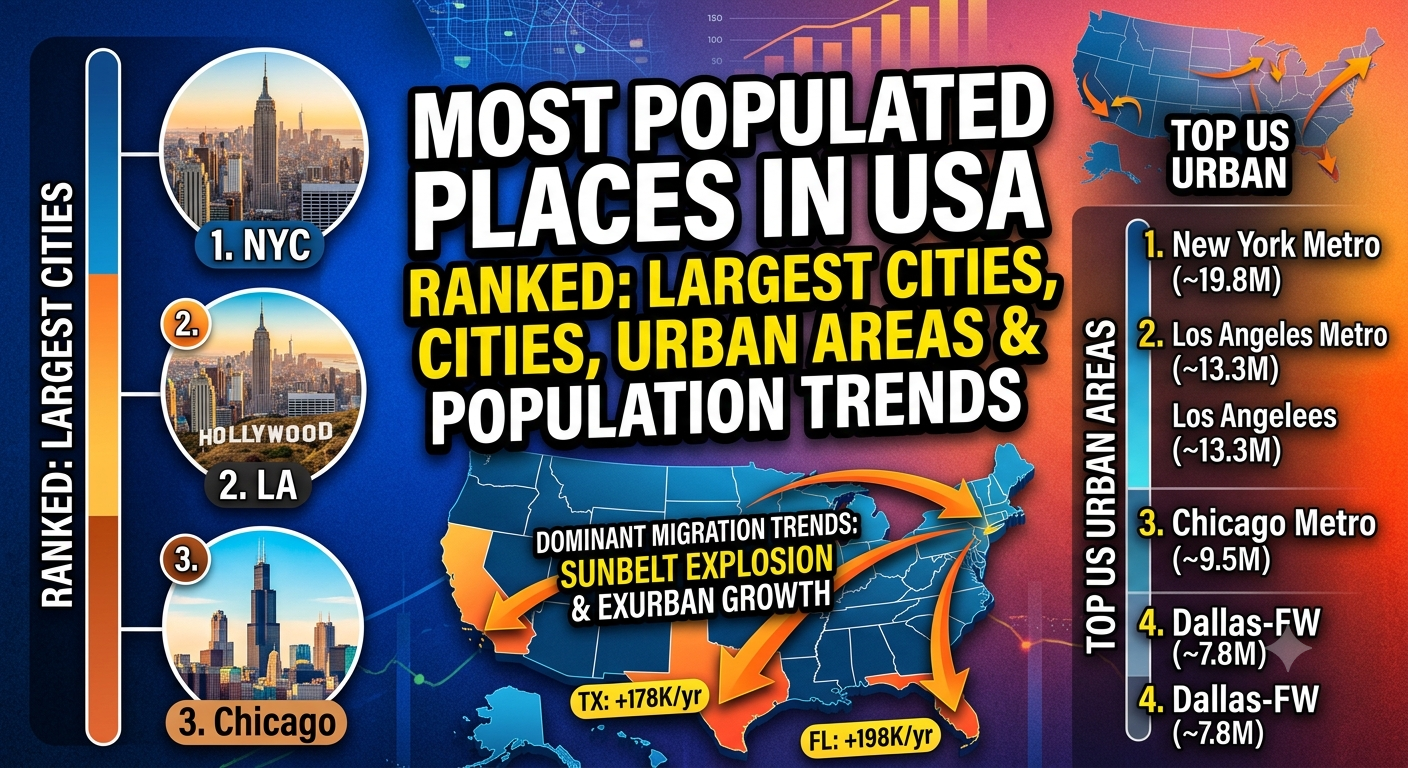
Understanding where Americans live—and where they are moving—provides vital insight into economic opportunities, real estate markets, infrastructure development, and shifting political power.
While traditional heavyweights like New York City and Los Angeles maintain their historical dominance at the top of the charts, a major geographic realignment is underway. Driven by housing affordability, remote work flexibility, and business-friendly climates, millions of residents continue to migrate toward Sunbelt metros in Texas, Florida, Arizona, and the Carolinas.
This article ranks the largest U.S. cities proper, the most populous Metropolitan Statistical Areas (MSAs), and analyzes the major demographic and migration trends shaping the American landscape.
City Proper vs. Metropolitan Area: Understanding the Distinction
Before diving into the numbers, it is essential to distinguish between a City Proper and a Metropolitan Statistical Area (MSA):
- City Proper (Incorporated Place): Defined strictly by legally bounded municipality borders. For example, the city proper of San Antonio, Texas, covers nearly 500 square miles, whereas Boston’s city limits cover only 48 square miles. As a result, municipal population counts often reflect historical annexations rather than true urban size.
- Metropolitan Statistical Area (MSA): Defined by the U.S. Office of Management and Budget (OMB) as a core urban center of at least 50,000 residents combined with surrounding suburban and exurban counties that share tight socio-economic and commuting ties. MSAs provide a far more accurate representation of an area’s economic weight and actual population density.
Example: The city proper of Miami, Florida, ranks 44th in the nation with roughly 450,000 residents. However, the Miami-Fort Lauderdale-West Palm Beach Metro Area ranks 8th overall, with over 6.3 million inhabitants.
Baca juga:Most Popular Roblox Games in the World: Complete Ranking of the Biggest Hits
Top 10 Most Populated U.S. Cities Proper (Ranked)
The following table ranks the ten largest incorporated cities in the United States based on U.S. Census Bureau estimates:
| Rank | City | State | Estimated Population | Geographic Region |
| 1 | New York City | New York | ~8.5 million | Northeast |
| 2 | Los Angeles | California | ~3.87 million | West |
| 3 | Chicago | Illinois | ~2.72 million | Midwest |
| 4 | Houston | Texas | ~2.39 million | South |
| 5 | Phoenix | Arizona | ~1.67 million | West / Southwest |
| 6 | Philadelphia | Pennsylvania | ~1.57 million | Northeast |
| 7 | San Antonio | Texas | ~1.54 million | South |
| 8 | San Diego | California | ~1.40 million | West |
| 9 | Dallas | Texas | ~1.32 million | South |
| 10 | Fort Worth | Texas | ~1.02 million | South |
Key Takeaways from the Top 10 Cities
1. New York City, NY (~8.5M)
New York City remains in a category of its own. With more than double the population of the second-largest city (Los Angeles), NYC is the economic and cultural epicenter of the nation. Despite notable post-pandemic suburban shifts, the city’s high natural population increase (births minus deaths) and international appeal continue to maintain its position.
2. Los Angeles, CA (~3.87M)
As the anchor of the West Coast, Los Angeles remains the country’s second-largest municipal jurisdiction. Known for entertainment, global commerce, and expansive urban sprawl, LA balances significant domestic out-migration with steady economic draw.
3. Chicago, IL (~2.72M)
Serving as the financial heart of the Midwest, Chicago retains its top-three ranking. While growth within city limits has remained modest, the city boasts world-class infrastructure, corporate headquarters, and high-density downtown living.
4. The Texas Quartet: Houston, San Antonio, Dallas, & Fort Worth
Texas accounts for four of the top ten largest cities in the United States.
- Houston (#4) is on pace to challenge Chicago for the #3 spot in coming decades due to rapid job growth, energy sector dominance, and a diverse population.
- San Antonio (#7) and Fort Worth (#10) represent two of the fastest-growing large cities by percentage, benefiting from abundant land, lower cost of living, and corporate relocations.
- Dallas (#9) anchors a combined megaregion that is among the fastest-expanding urban centers in North America.
5. Phoenix, AZ (#5)
Phoenix has experienced remarkable decades-long growth, climbing into the top five. Driven by year-round sunshine, tech sector expansion, and sprawling suburban housing development, the Valley of the Sun continues to attract relocations from California and the Midwest.
Top 10 Largest U.S. Metropolitan Statistical Areas (MSAs)
When examining entire metropolitan regions, the rankings shift to reflect the full footprint of urban economic powerhouses.
| Rank | Metropolitan Area | Primary States | Estimated Population | Key Characteristics |
| 1 | New York-Newark-Jersey City | NY-NJ-PA | ~19.8 million | Financial capital, vast regional rail transit network |
| 2 | Los Angeles-Long Beach-Anaheim | CA | ~13.3 million | Major trade port hub, entertainment industry capital |
| 3 | Chicago-Naperville-Elgin | IL-IN-WI | ~9.5 million | Midwest economic powerhouse, major transportation nexus |
| 4 | Dallas-Fort Worth-Arlington | TX | ~7.8 million | Leading U.S. metro for total annual population gains |
| 5 | Houston-Pasadena-The Woodlands | TX | ~7.3 million | Energy capital of the world, massive port operations |
| 6 | Atlanta-Sandy Springs-Alpharetta | GA | ~6.5 million | Southeast commercial hub, rapid suburban growth |
| 7 | Washington-Arlington-Alexandria | DC-VA-MD-WV | ~6.4 million | Federal government hub, booming defense & tech corridors |
| 8 | Miami-Fort Lauderdale-West Palm Beach | FL | ~6.3 million | Gateway to Latin America, massive international migration |
| 9 | Philadelphia-Camden-Wilmington | PA-NJ-DE-MD | ~6.2 million | Historic East Coast corridor, higher education & health care |
| 10 | Phoenix-Mesa-Chandler | AZ | ~5.1 million | Major Southwest growth engine, semiconductor hub |
Key Population Trends Driving American Realignment
Population numbers are not static. Recent data from the U.S. Census Bureau highlights several macro-level trends reshaping the demographics of the country:
  ┌─────────────────────────────────────────────────────────────┐
  │                 DOMINANT DEMOGRAPHIC SHIFTS                │
  └──────────────────────────────┬──────────────────────────────┘
                                 │
         ┌───────────────────────┼───────────────────────┐
         ▼                       ▼                       ▼
  【 Sunbelt Expansion 】   【 Exurban Growth 】    【 Migration Drivers 】
   • Texas & Florida        • Outer-ring counties   • Remote work flexibility
   • Job growth & tax       • Housing affordability • High cost of living in
     advantages               & hybrid schedules      coastal urban cores
1. The Sunbelt Boom vs. Rust Belt and Coastal Stabilization
The migration pattern across America remains clearly oriented toward the Sunbelt region—stretching across the South and Southwest.
- Texas and Florida Lead Total Gains: Texas metro areas like Dallas-Fort Worth (+178,000 annual gain) and Houston (+198,000 annual gain) consistently lead the nation in absolute population growth.
- Mid-Sized Southern Metros Skyrocketing: Metros like Ocala, FL, Raleigh, NC, and Greenville, SC are experiencing some of the highest percentage growth rates in the country, often exceeding 2% to 3% annually.
- Coastal Realignment: While massive coastal metros like New York and Los Angeles maintain their lead through natural population increase and international immigration, they experience consistent net domestic migration loss to Sunbelt destinations.
2. The Explosive Rise of the “Exurbs”
One of the most noticeable post-2020 urban shifts is the rapid expansion of exurbs—counties located on the outer edges of major metropolitan areas.
- High urban housing prices, combined with widespread adoption of remote and hybrid work models, have pushed families toward outer-ring suburban and exurban counties.
- Fast-growing counties such as Collin County, TX (outside Dallas), Montgomery County, TX (outside Houston), and Pinal County, AZ (outside Phoenix) continue to absorb thousands of new residents fleeing urban centers in search of larger, more affordable housing.
3. Components of Population Change: Migration vs. Natural Increase
U.S. population trajectory is determined by three main drivers:
- Net Domestic Migration: Movement of residents from one U.S. county or state to another. Large metro core counties (populations > 1M) lost over 600,000 residents via domestic migration in recent years, redistributing population to smaller metros and exurbs.
- Net International Migration (NIM): Inflow of foreign-born individuals. NIM remains a vital stabilizing force for primary urban hubs like New York, Chicago, Miami, and San Francisco, offsetting domestic migration losses.
- Natural Increase (Births minus Deaths): Due to an aging national population and declining birth rates, natural increase has slowed significantly nationwide. Certain regions (such as retirement communities in Florida or Pennsylvania) now experience natural decrease, relying entirely on inward migration to maintain population levels.
Future Outlook: What the U.S. Urban Landscape Will Look Like
As America moves further into the late 2020s and toward 2030, demographers anticipate several key shifts:
- Dallas-Fort Worth Approaching 10 Million: The DFW metroplex is on track to surpass 9 to 10 million residents before 2030, potentially challenging Chicago for the spot of the 3rd-largest metro area in the nation.
- Emergence of “Megaregions”: Urban boundaries are continuing to blur. Regions like the Texas Triangle (Dallas, Houston, Austin, San Antonio) and the Florida Peninsula Megaregion (Tampa-Orlando-Miami) are forming continuous urban corridors linked by economic trade and transportation networks.
- Infrastructure Challenges: Fast-growing Sunbelt cities face increasing pressure to expand public transit, upgrade water systems, manage housing affordability, and bolster climate resilience against extreme heat and coastal storms.
Conclusion
The population map of the United States reflects a dynamic balance between legacy coastal giants and booming Sunbelt centers. While New York City and Los Angeles remain the unrivaled heavyweights of American urban culture and commerce, the relentless expansion of cities in Texas, Florida, and Arizona highlights a ongoing shift in where Americans choose to live, work, and build their futures.
Penulis: W.S






Post Comment